Our data shows that worldwide public sector sites perform significantly better than privately-operated sites, but there’s still room for improvement across the board.
Hi. We’re Silktide. We help organizations find accessibility issues on their websites and help them understand how to fix them.
You may have seen the Silktide Index – the accessibility league table encompassing various industries and sectors.
For Global Accessibility Awareness Day (#GAAD – external link) we decided to pull some data out of the Index and give a run down on the state of accessibility across different sectors.
We created the Index to help raise awareness of web accessibility, and the consensus is that people find it super useful. So we’re distilling our findings from May 2021 into this post.
Strap yourselves in, this is going to be a long article! Here’s what’s coming up.
- What is this report about?
- What is web accessibility?
- How we tested the websites
- The results and data
- Common accessibility issues
- Conclusions
If you want to skip ahead to the results and data, click this link.
What is this report about?
We analyzed 6,554 websites and 758,408 web pages across multiple sectors for accessibility issues. This report breaks down our findings. In the results and data section, you’ll find:
- The differences between public and private web accessibility
- A comparison of public sectors sites by country
- Differences between accessibility across worldwide universities
- Which industry sectors have the most accessible websites
- A breakdown of WCAG A and WCAG AA scores by sector
- A list of the most accessible CMS’
This report is based on our findings from our May 2021 Index and encompasses every website in the Index as of that date.
What is web accessibility?
Web accessibility is the process of ensuring that your web services cater to a wide range of user’s needs. It’s not always about disability, although that is the first thing most people think of.
How does poor web accessibility affect people?
Let’s say your user is blind or has impaired vision. They use a screen reader, which is a piece of technology that reads the content of your website out to them. They can navigate through your headings, to get straight to the content they need to. They can also fill in forms and otherwise have an enjoyable experience on your site.
Unless of course, your website isn’t accessible, then it becomes a very difficult task.
What if you missed the ‘Skip to Content’ link for screen reader users? The impact of doing so means your users might have to tab through tens of navigation links to read the first page heading.
What if you present useful information in images that don’t have alternative text? Or a form with no labels, so there’s no way to know where to put your name, address, or phone number?
Or how about intrusive popup cookie banners, modals, or chat bots that steal focus from screen readers?
These are common accessibility issues that are relatively easily fixed.
Considering situational accessibility
Let’s consider ‘situational accessibility’. If a user has low vision they need text contrast to be high enough that it’s readable. The same applies to a person with excellent vision who happens to be using their device in bright sunlight.
A user might not be able to hear the audio in a piece of your content because they are either deaf, have an ear infection, or are in a loud room. These three problems are all fixed with the same solution – adding subtitles and transcripts to audio and visual media.
Indeed, many accessibility issues affect all users to some degree, and often a single solution improves the experience for everyone.
Accessibility, then, goes hand in hand with usability.
For more information on this, watch our webinar ‘How web accessibility affects people in the real world’.
How we tested
We gathered a sample of up to 125 web pages from each website and tested those against around 200 accessibility criteria.
The basis for our tests are the WCAG 2.1 guidelines (external link).
We update the results each month and all information, including previous monthly results, is available. This report is based on data from our testing in May 2021.
How we assign a score.
The website’s Accessibility Score is a weighted combination of all three levels (45% for Level A, 40% for AA, 15% for AAA).
Each WCAG 2.1 Level is rated out of 100.
The results and data
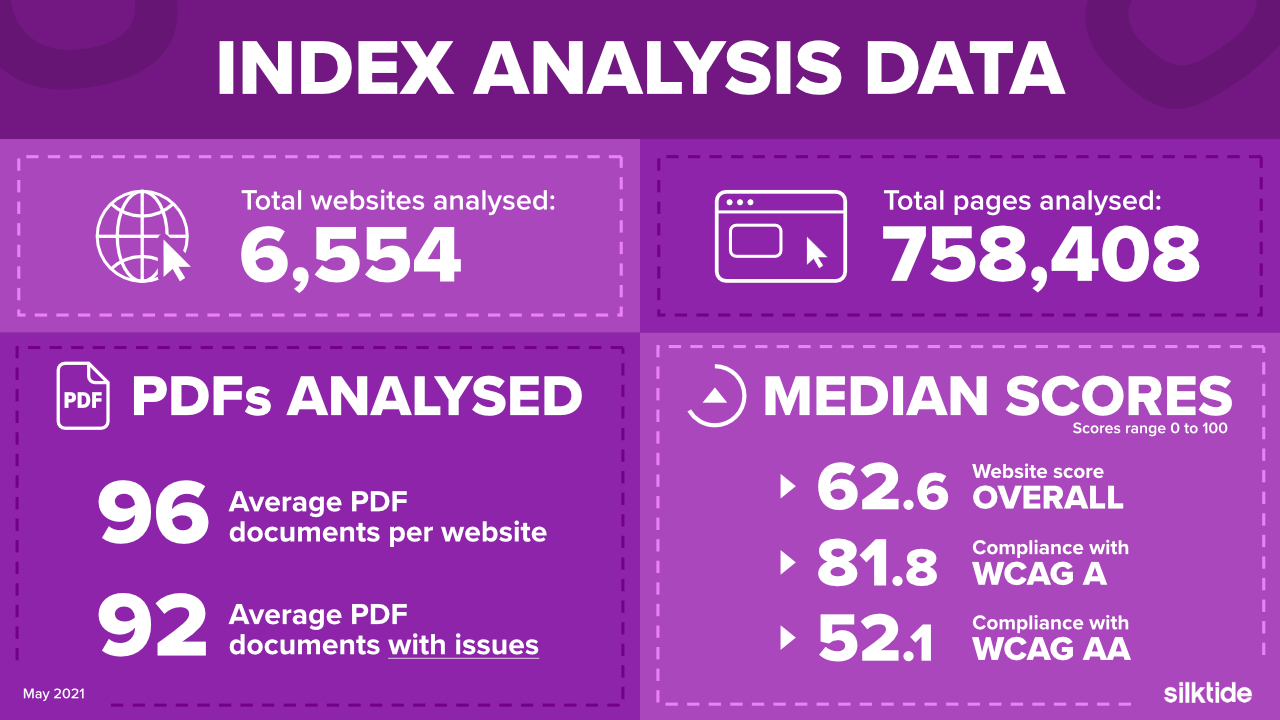
We analyzed 6,554 websites and 758,408 web pages in total.
We found that the median overall score across all websites was 62.59.
The median WCAG 2.1 A score was 81.8, while the median WCAG AA score was 52.1.
The average number of pages tested per sites was 115.
We found an average of 96 PDFs on each website, and the average number of PDFs found with at least one accessibility issue was 92.
Public/private sector comparison
Overall
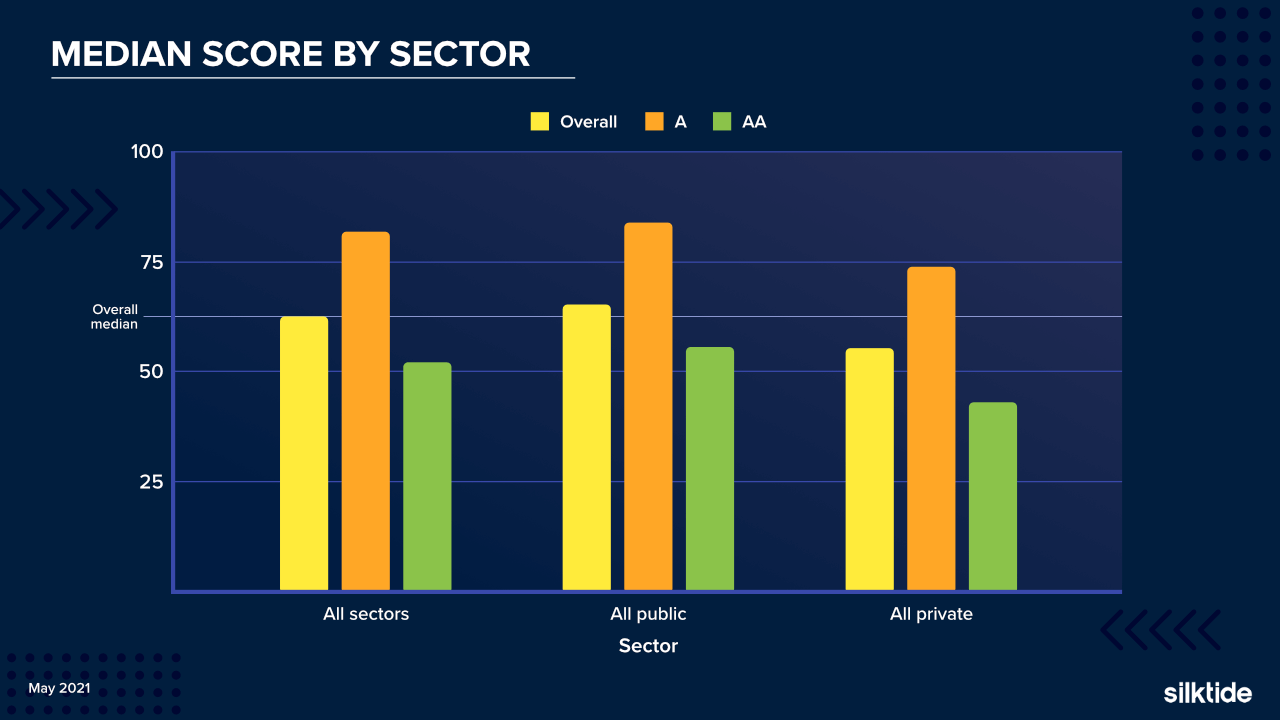
The overall public sector median score was 65.30, while the overall private sector median score was 55.50.
Breaking this down, the WCAG A median score for public sector was 83.80, and for private sector, 73.80.
WCAG AA median scores were 55.60 and 43.00 for private and public sector respectively.
By location
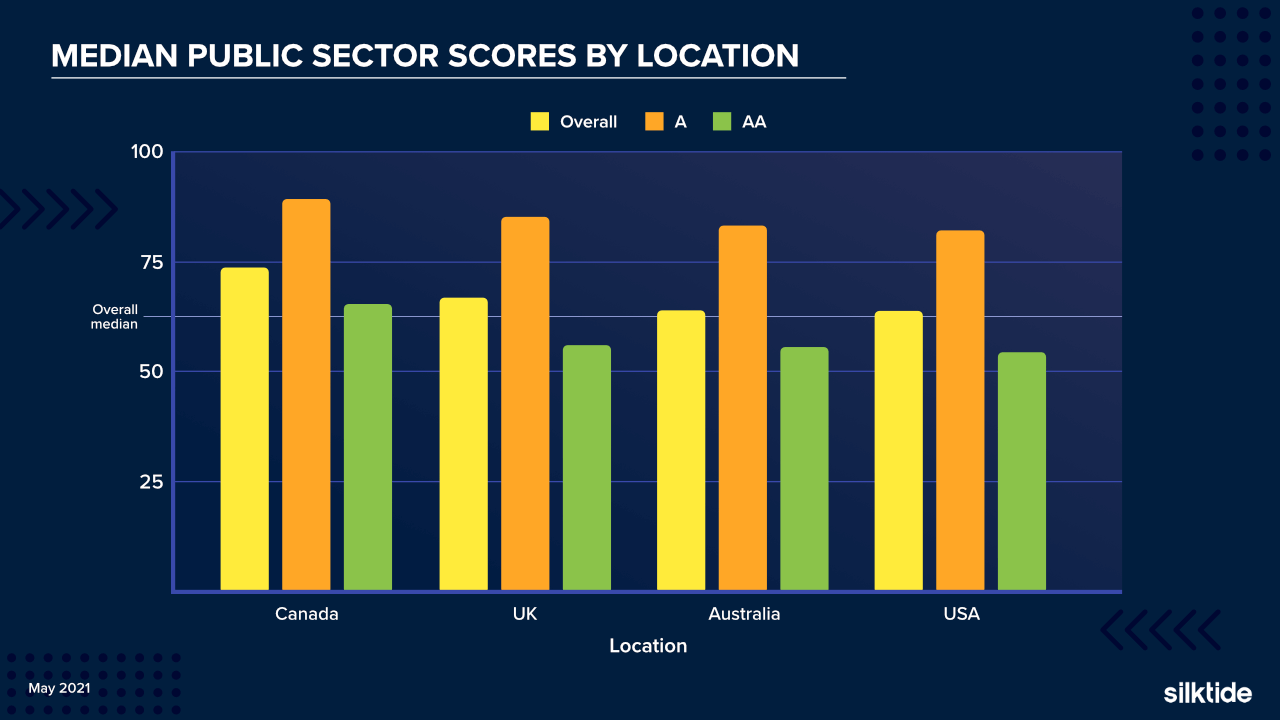
We split the public sector results up by geographical area. We included the UK, Canada, the United States, and Australia.
The overall scores were:
- Canada 73.60
- United Kingdom 66.70
- Australia 63.90
- United States 63.79
WCAG A scores were:
- Canada 89.19
- United Kingdom 85.25
- Australia 83.19
- United States 82.19
WCAG AA scores were:
- Canada 65.30
- United Kingdom 55.95
- Australia 55.70
- United States 54.20
Public and private sector: 90th and 10th percentile comparison
By taking the top and bottom performers across the public and private sectors, we get a more meaningful picture of how well organizations perform.
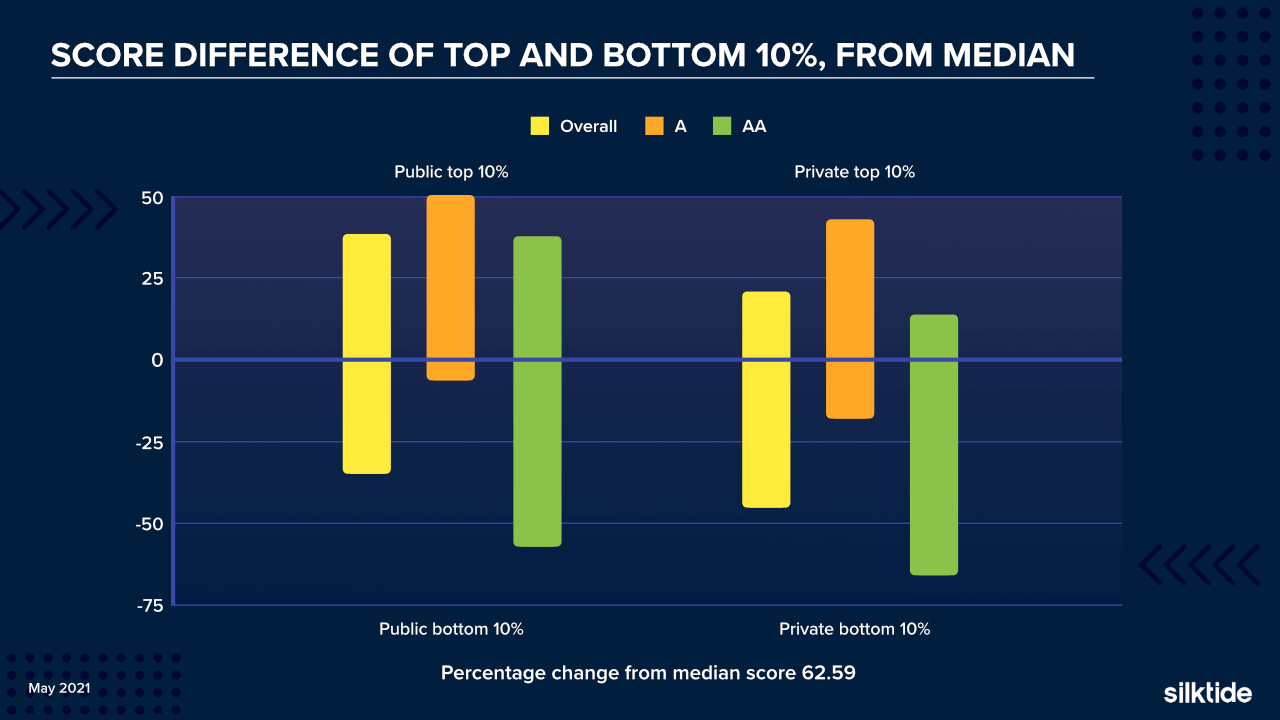
We split the data across the 90th and 10th percentile, and further split by WCAG level.
Then we compared the figures to the overall median score across the entire index.
The overall scores were as follows:
- Public sector 90th percentile: 38.34% above median
- Private sector 90th percentile: 21.11% above median
- Public sector 10th percentile: 34.81% below median
- Private sector 10th percentile: 45.17% below median
Comparison of worldwide universities
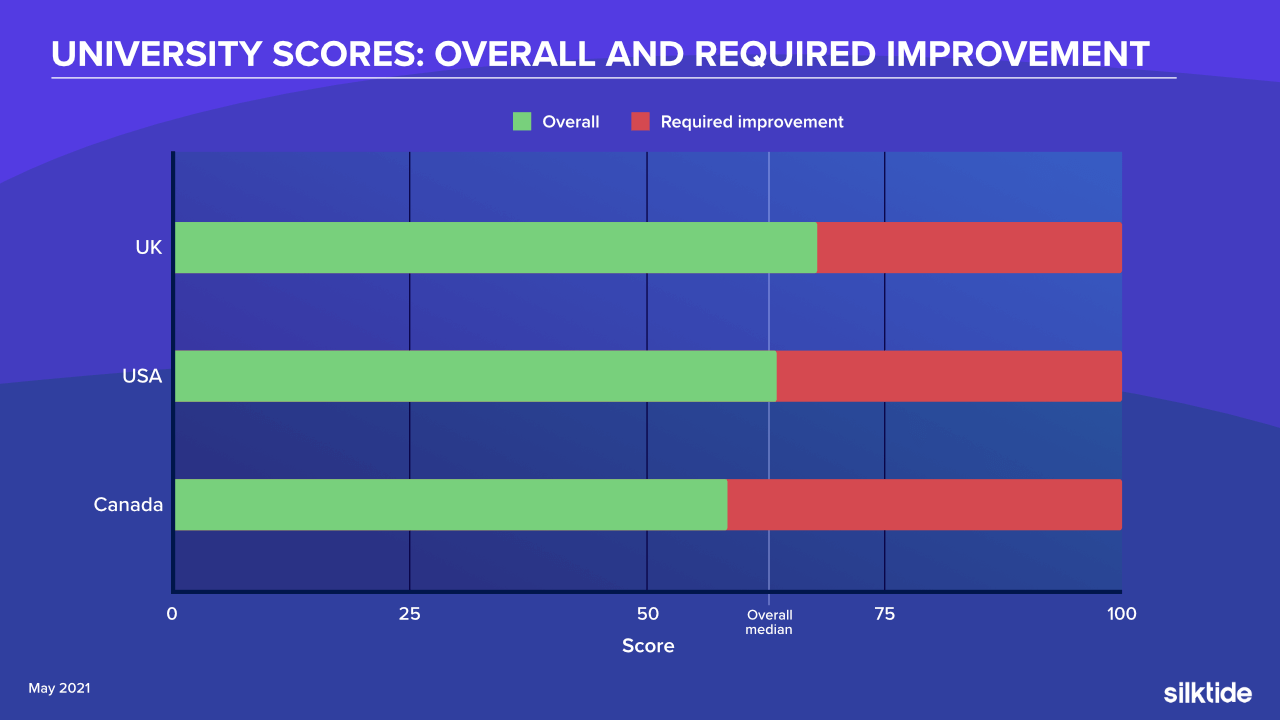
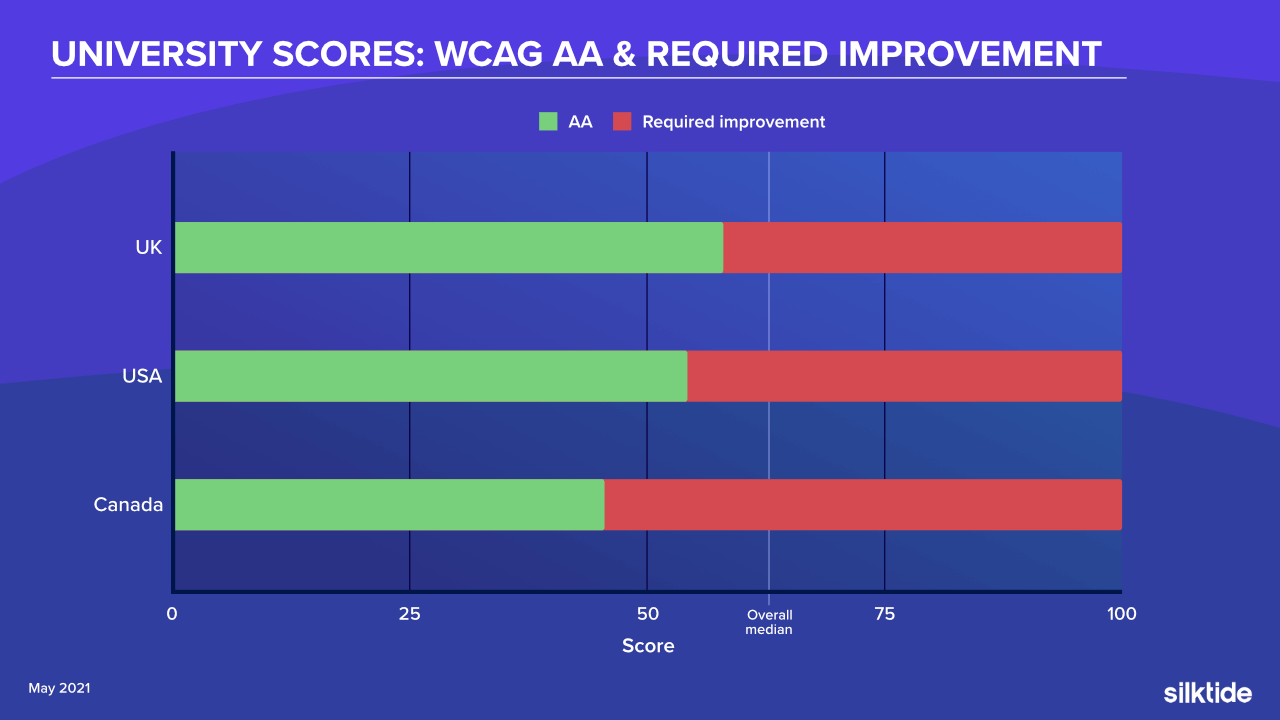
The index contains data on UK universities (159), US universities and colleges (1851), and Canadian universities (86).
The overall accessibility scores are as follows:
- United Kingdom 67.90
- United States 63.79
- Canada 58.40
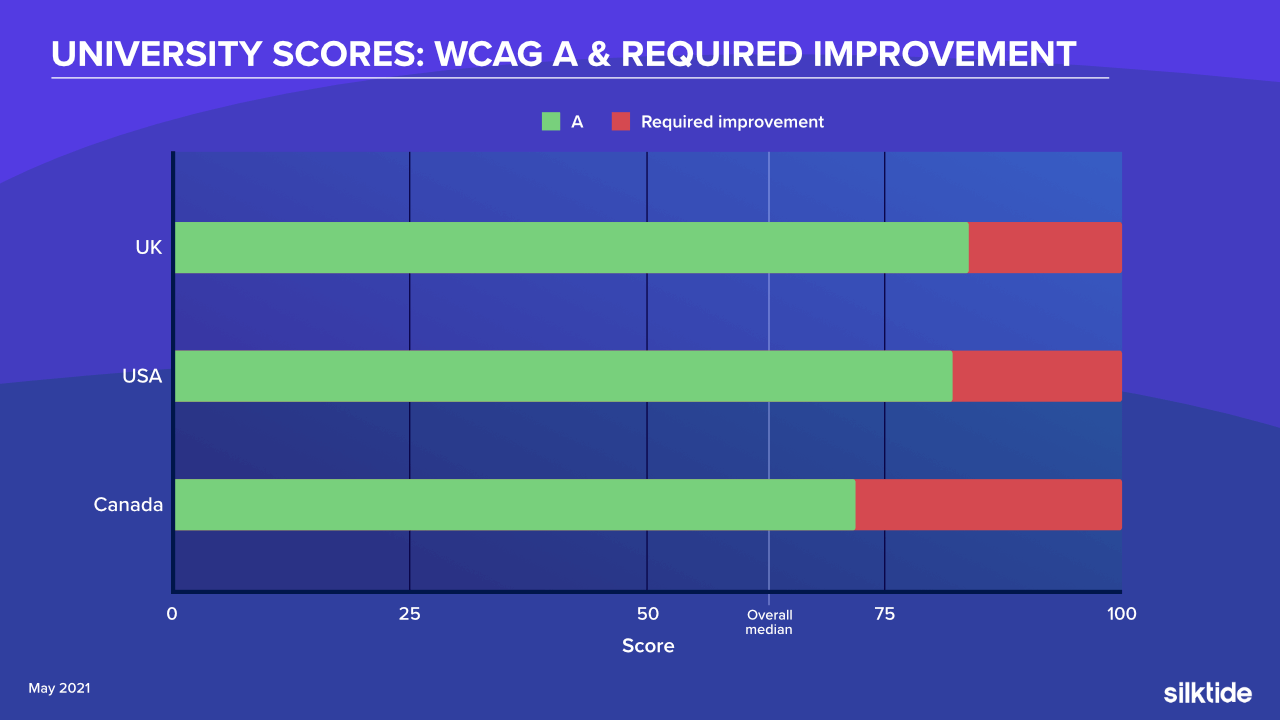
WCAG Level A scores are as follows:
- United Kingdom 83.90
- United States 82.19
- Canada 71.95
WCAG Level AA scores are:
- United Kingdom 58.00
- United States 54.20
- Canada 45.60
Accessibility by industry
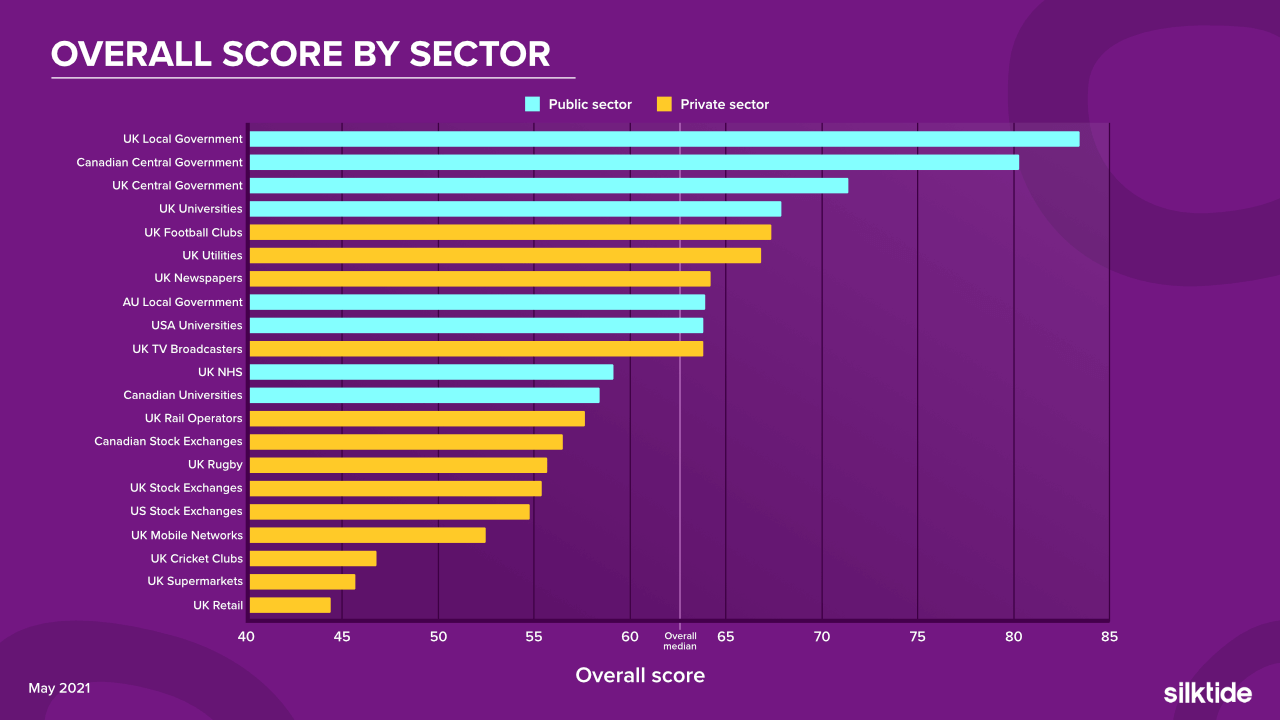
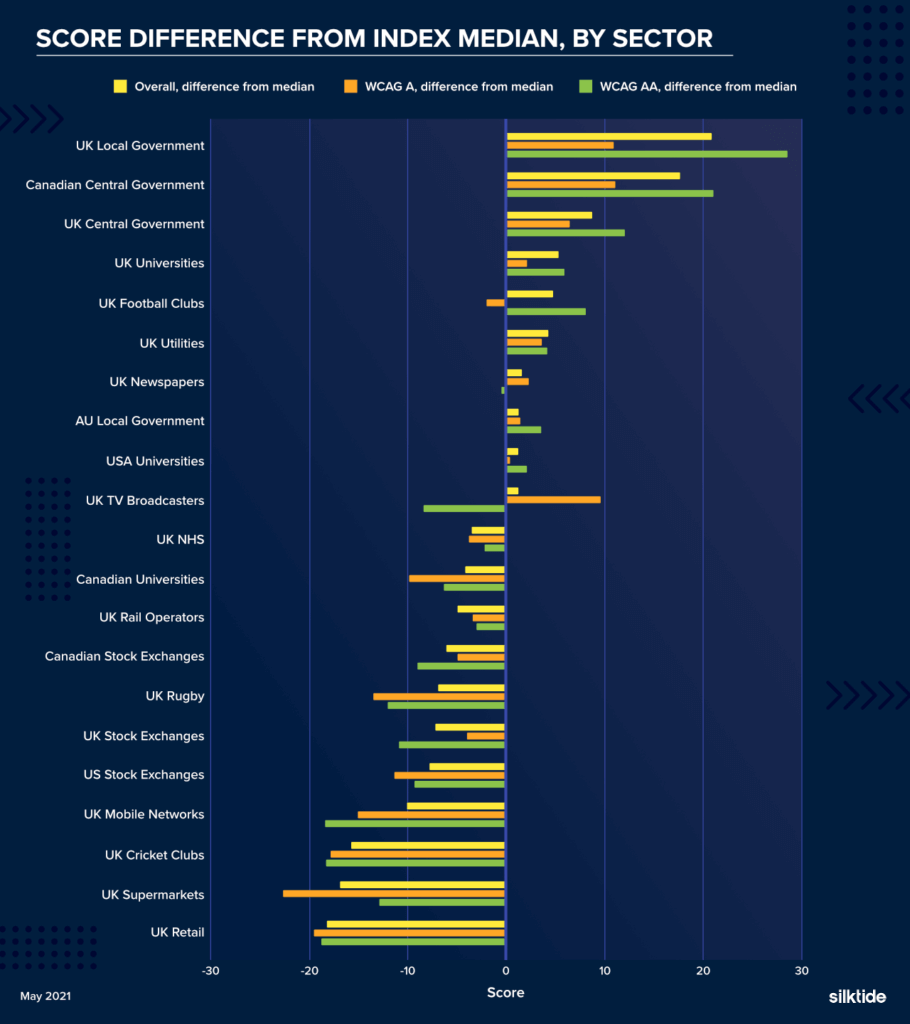
The top four most accessible sectors in the May 2021 Silktide Index are:
- UK local government 83.45 (20.84% above median)
- Canadian central government 80.30 (17.70% above median)
- UK central government 71.40 (8.80% above median)
- UK universities 67.90 (5.3% above median)
The bottom four least accessible sectors in the May 2021 Silktide Index are:
- UK retail 44.40 (18.18% below median)
- UK supermarkets 45.70 (16.89% below median)
- UK cricket clubs 46.80 (15.80% below median)
- UK mobile networks 52.50 (10.10% below median)
Accessibility by CMS
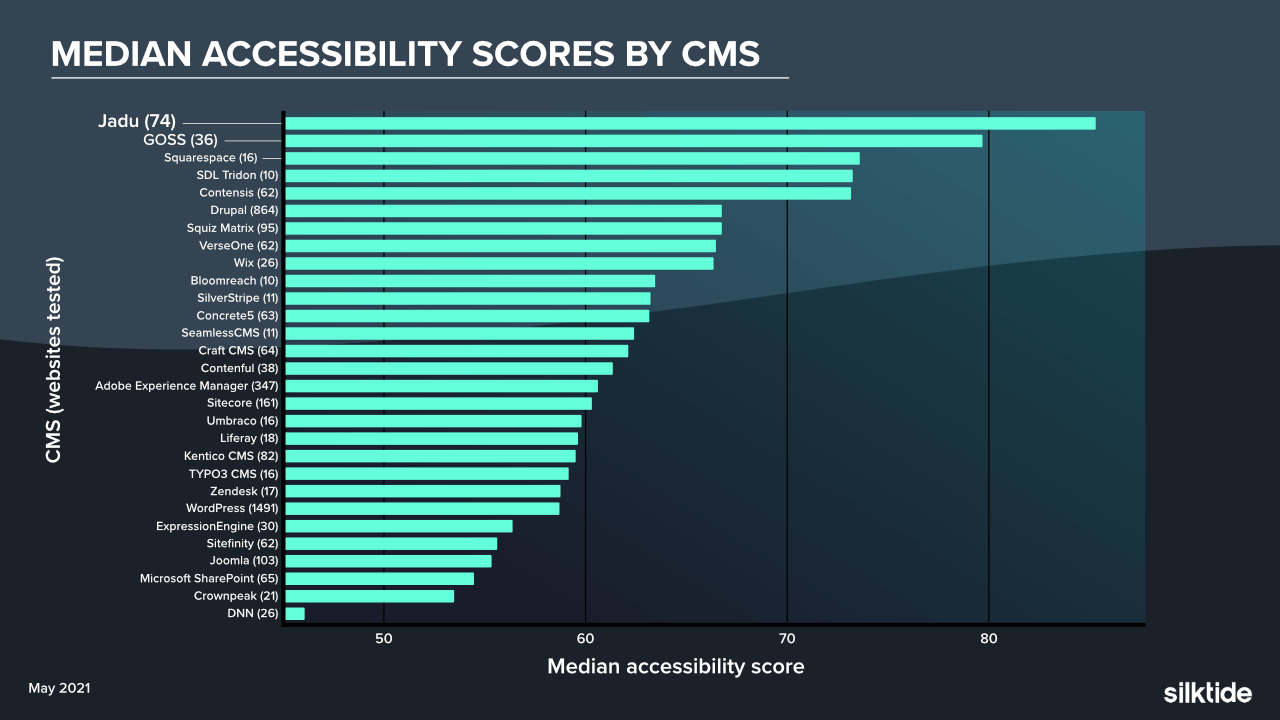
Where possible, we detect which CMS is in use by a website in the Index. We’ve included data for any CMS’ with at least ten entries in the report along with sample sizes.
Our data suggests that the most accessible CMS’ are:
- JADU 85.30 (sample size 74)
- GOSS 79.68 (sample size 36)
- Squarespace 73.58 (sample size 16)
Our data suggests the least accessible CMS’ are:
- DNN 46.03 (sample size 26)
- Crownpeak 53.46 (sample size 21)
- Microsoft SharePoint 54.47 (sample size 65)
Common accessibility issues
Our data shows a number of common issues that are present in every sector. Here are the top five.
Avoid using the same link text for different destinations (WCAG A 2.4.4)
Screen reader users will see links on a page listed without context, so you should ensure the same link text is not used to point to different web addresses.
Ensure form controls have labels (WCAG A 1.3.1)
People using screen readers are not able to see the layout of a form. To make forms accessible, they must define explicit text labels for each form control.
Ensure text has sufficient contrast (WCAG AA 1.4.3)
The color of text must sufficiently contrast with its background color so that people with moderate visual impairments can read it. Our demo report shows examples of color contrast.
Ensure controls change appearance when selected (WCAG AA 2.4.7)
All controls on the page – including links, buttons, and fields – should show when they have been selected by the keyboard.
Ensure links explain their purpose (WCAG A 2.4.4)
The purpose of a link should be clear from the text inside the link. Links like “learn more” are not helpful to users with accessible technology.
Discussion
What can we conclude from this data? Headline takeaways are:
Public sector websites globally outrank private sector sites
Legislation such as the EU Web Accessibility Directive, Section 508, the ACA, and the DDA (Australia) mandates public sector sites to be accessible to a certain standard.
The private sector is not subject to such legislation in these regions, save for the ADA which applies to certain US businesses over a given size.
You might conclude that the disparity between scores between these sectors is because private sector companies are, in the EU at least, not likely to be sued for having an inaccessible website. Nor are they subject to regular auditing by central governments in the way that public sector websites are.
Other factors may include people simply not being aware of the impact of poor accessibility on web users. It’s hard to fix a problem if you don’t know you have one.
Canadian public sector sites scored the best overall, followed by the UK, Australia, and the United States.
UK, Australia, and USA public sector sites have fairly similar WCAG A and AA scores. But the real difference is that Canada has, on average, a 10 point lead in AA scoring.
So while all regions have, on the whole, excellent WCAG A accessibility, Canada wins out by going further in its AA scoring.
UK universities rank best for accessibility, followed by US and Canadian universities.
There’s not much between the UK and USA WCAG A scores, but Canada falls behind here which drags their overall score down to 58.39, compared to 67.90 and 63.79 for UK and US university sites.
- The best public sector sites overall score 38.34% above the median, while the best private sector sites score 21.11% above the median
- Conversely, the lowest-scoring public sector sites score 34.81% below the median, while private sector sites score 45.17 below the median.
Comparing the 90th percentile of public and private sector sites to the overall Index median, we can see that the very best public sites outrank the very best private sites by some margin.
Also, the lowest performing public sites score considerably more poorly compare with even the lowest scoring public sector sites.
The most accessible sector is UK local government, followed closely by Canadian central government.
Taking individual sectors, we can see that the UK local government index has the best score overall, with 83.45 overall. Canada scores a little higher in WCAG A, but where they lose the top spot is to the UK’s WCAG AA score of 80.64 (compared to 73.10 for Canada).
Out of the entire Index, the top 20 sites for accessibility are all owned by UK councils.
The least accessible sector is UK Retail, along with UK Supermarkets
This is an interesting result, especially in light of the pandemic we’re currently in. UK retail has shifted online by as much as 78.2% due to various lockdowns (external link), so to score so poorly in general accessibility means that likely a lot of web users have been unable to engage with those businesses.
So there is some room for improvement in these sectors and perhaps now is the time to start a wider web accessibility discussion in the private sector.
The highest-scoring CMS for accessibility is Jadu, followed by GOSS and Squarespace.
Now, there are a lot of moving parts with these results, and a CMS generally is only as good as the developers who use it. That said, some CMS’ don’t give as much control over certain accessibility features, like adding alternative text, so those would score lower overall.
Either way, it’s interesting to see JADU score at the top here. They design and test their themes for accessibility before handing them over to their customers to populate. Many of the websites here are also in the UK local government, the top-scoring sector overall.
It’s good to see organizations putting in the hard work to improve accessibility for everyone.
Sectors with higher WCAG AA scores rank more highly than those only focused on WCAG A accessibility.
This is fairly obvious as both scores combine to form the overall score. That said, some sectors would not be particularly distinguishable if you only take into account WCAG A scores.
For example, the comparison between public sector sites by region. There wouldn’t be much to tell apart UK, USA, Canada, and Australian organizations if we were not also considering the WCAG AA scores.
The same accessibility issues come up again and again.
The common issues we find in the Index are often the same from month to month.
Inaccessible links, insufficient color contrast, and incorrectly labeled forms are the most common issues by far.
We also find that PDF accessibility is a real challenge from our conversations with our customers (we have an hour-long webinar available with practical examples of how to make accessible PDFs).
Our advice is to not use PDFs if at all possible. Instead, supply an HTML version of the information.
Conclusion
There’s certainly a contrast between the public and private sector in terms of global accessibility.
Legislation is likely a huge part of this. Indeed, our data shows that UK councils (now among the most accessible websites in the Index) have improved their accessibility scores dramatically since February 2020.
The EU Web Accessibility Directive deadline in September 2020 gave focus to these organizations to make their websites better. And while most were already working towards this goal, a lot of feedback we get from the sector is that the Index has been really helpful in tracking their progress.
We’re always the first to say that automated accessibility testing is a tool (and a great one) but should never be used in isolation.
You should combine automated accessibility testing with manual testing for the full picture. We’d also recommended testing using screen readers, such as Voiceover (iOS) or Talkback (Android).
We hope you’ve found this article useful. You can learn more about our accessibility testing software (we also have a demo report on our website available).
To see the accessibility leaderboards visit the Silktide Index.

