AI Analytics
Turn every data point into ready-to-approve action
Silktide reads your data and inspects your pages, then turns the findings into a prioritized plan for improving your website.
Rated 4.8 out of 5 from 288 reviews on G2.

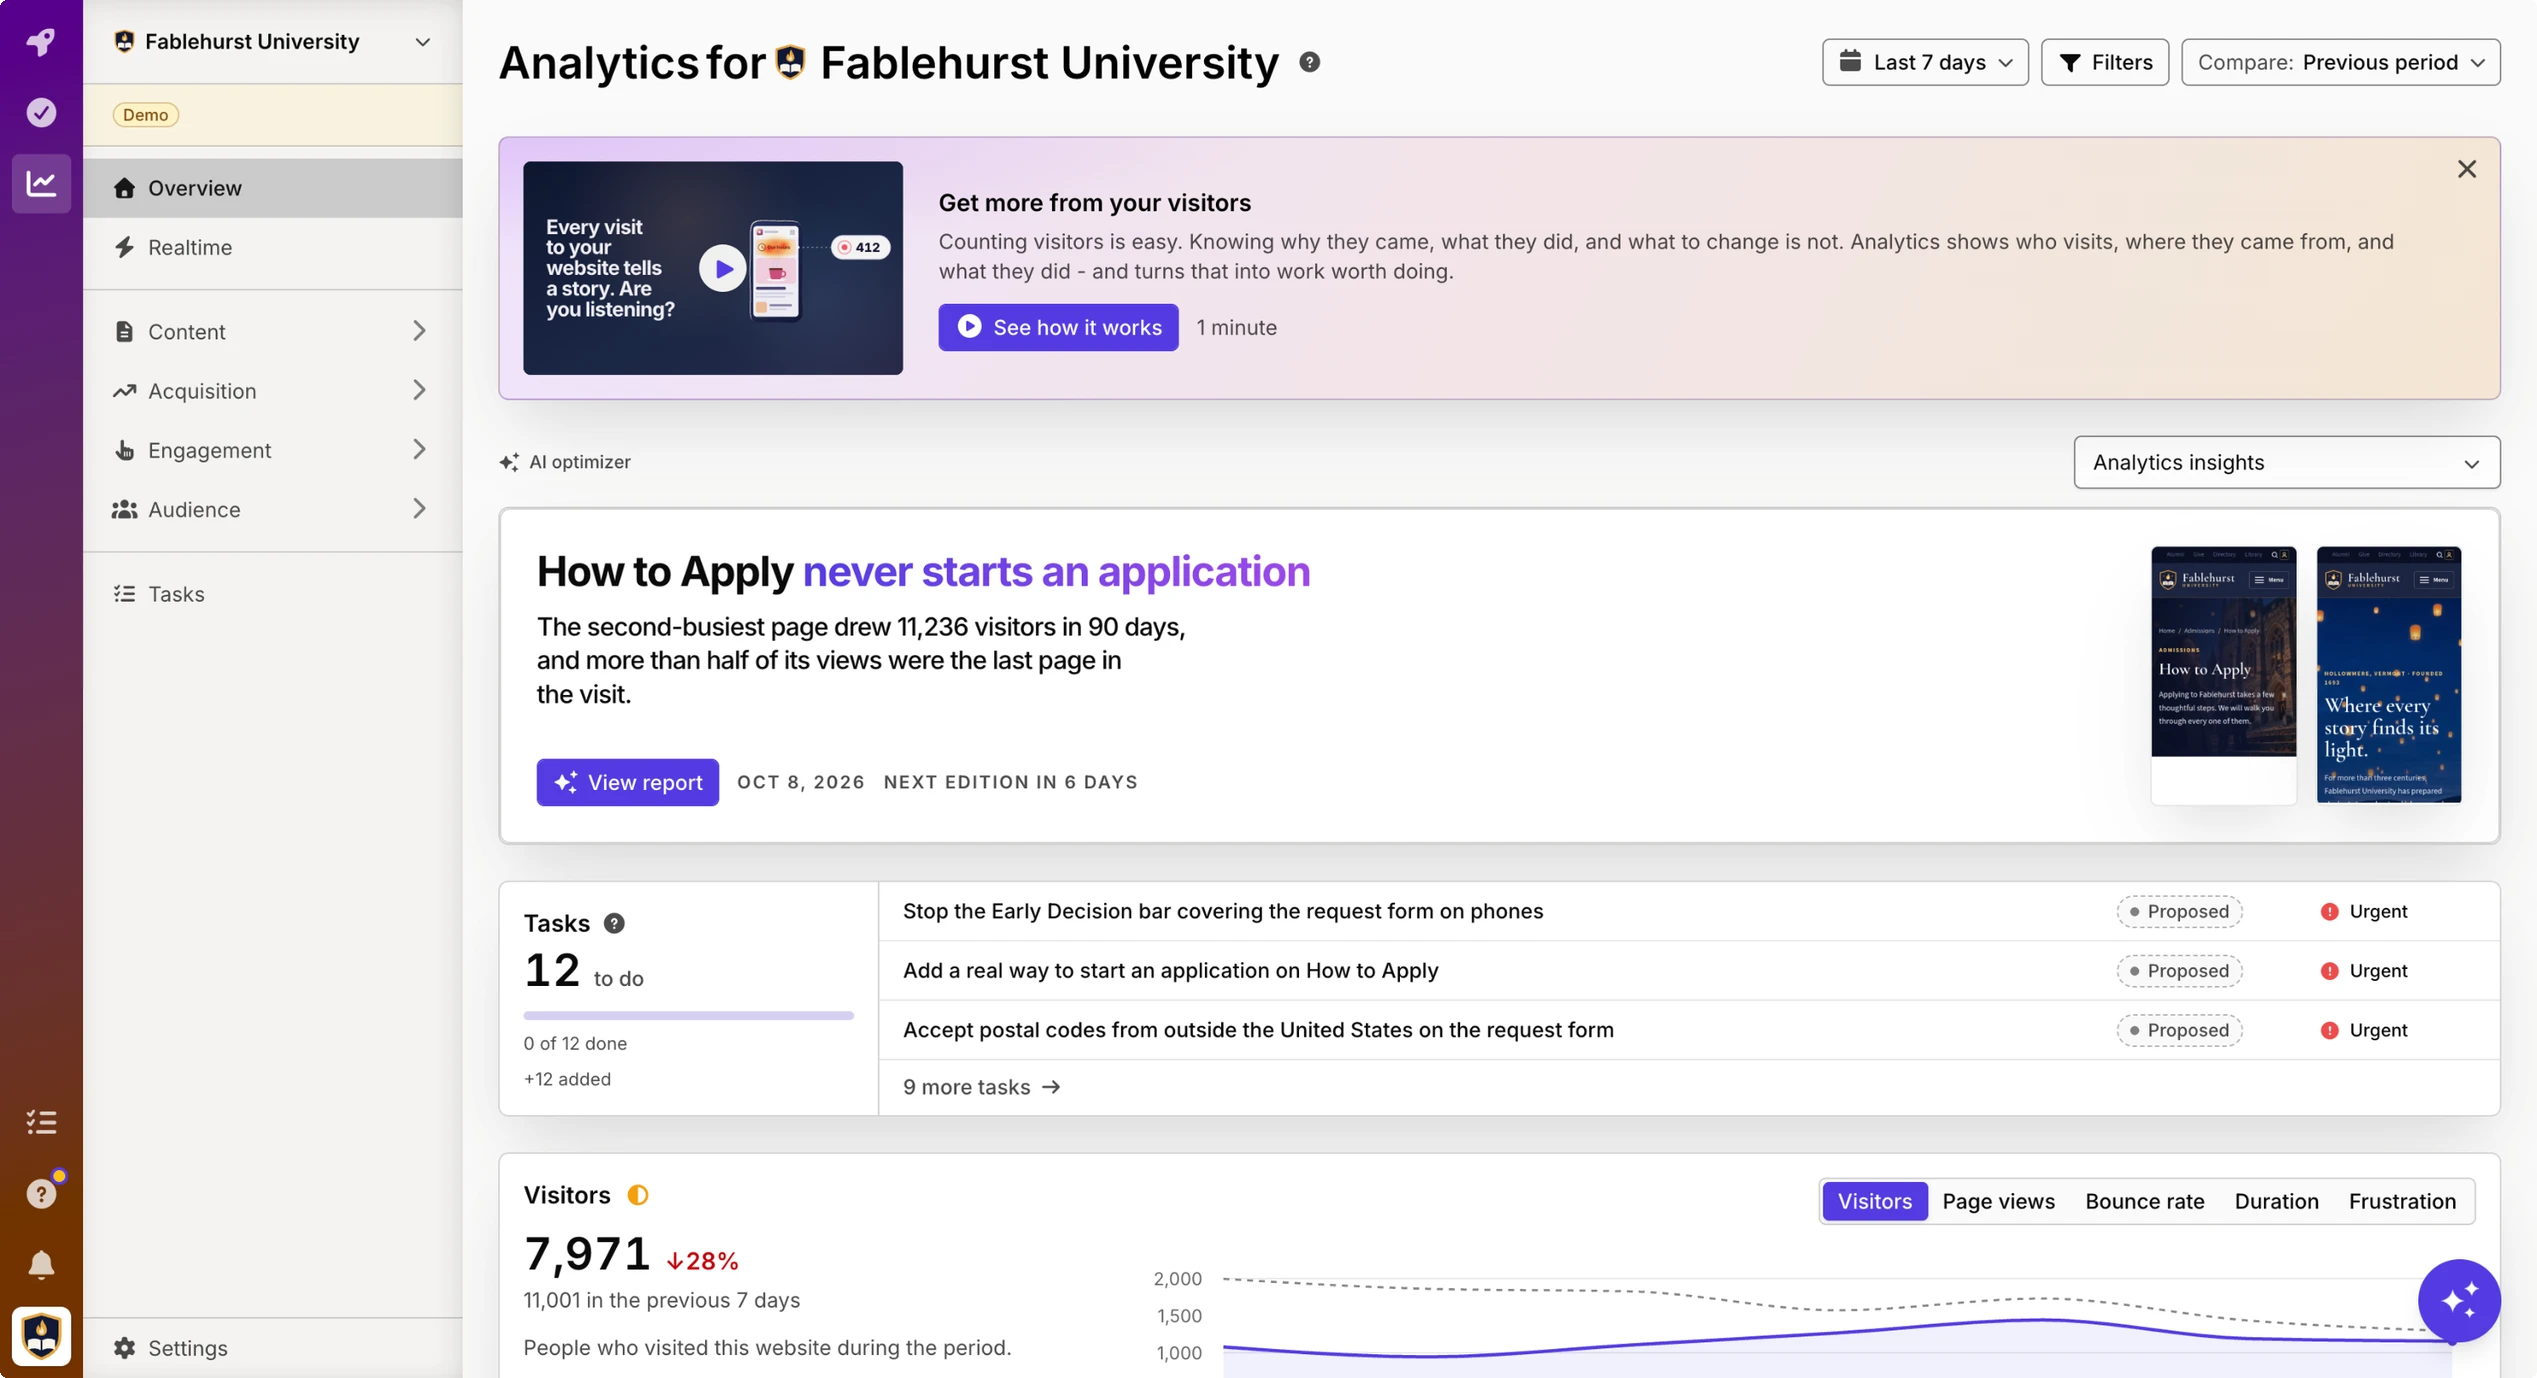
Connect visitor behavior to the page behind it. Start optimizing user journeys that convert.
Get found by AI, and represented accurately.
Silktide tests your site at the page level to make sure AI crawlers like GPTBot, ClaudeBot, and PerplexityBot can access your content and find concise, evidence-backed answers to real user questions.
-
1. Understand
Track traffic sources, campaign channels, and real visitor engagement across every page, including visits arriving directly from AI assistants like ChatGPT, Claude, and Perplexity.

-
2. Inspect & optimize
Run automated AI strategy reports that analyze user heatmaps, scroll folds, and frustration signals on live page layouts to identify conversion barriers.

-
3. Execute & retest
Route evidence-backed tasks straight to your engineering and content boards, then track goal completions over time.

Heatmaps and scroll
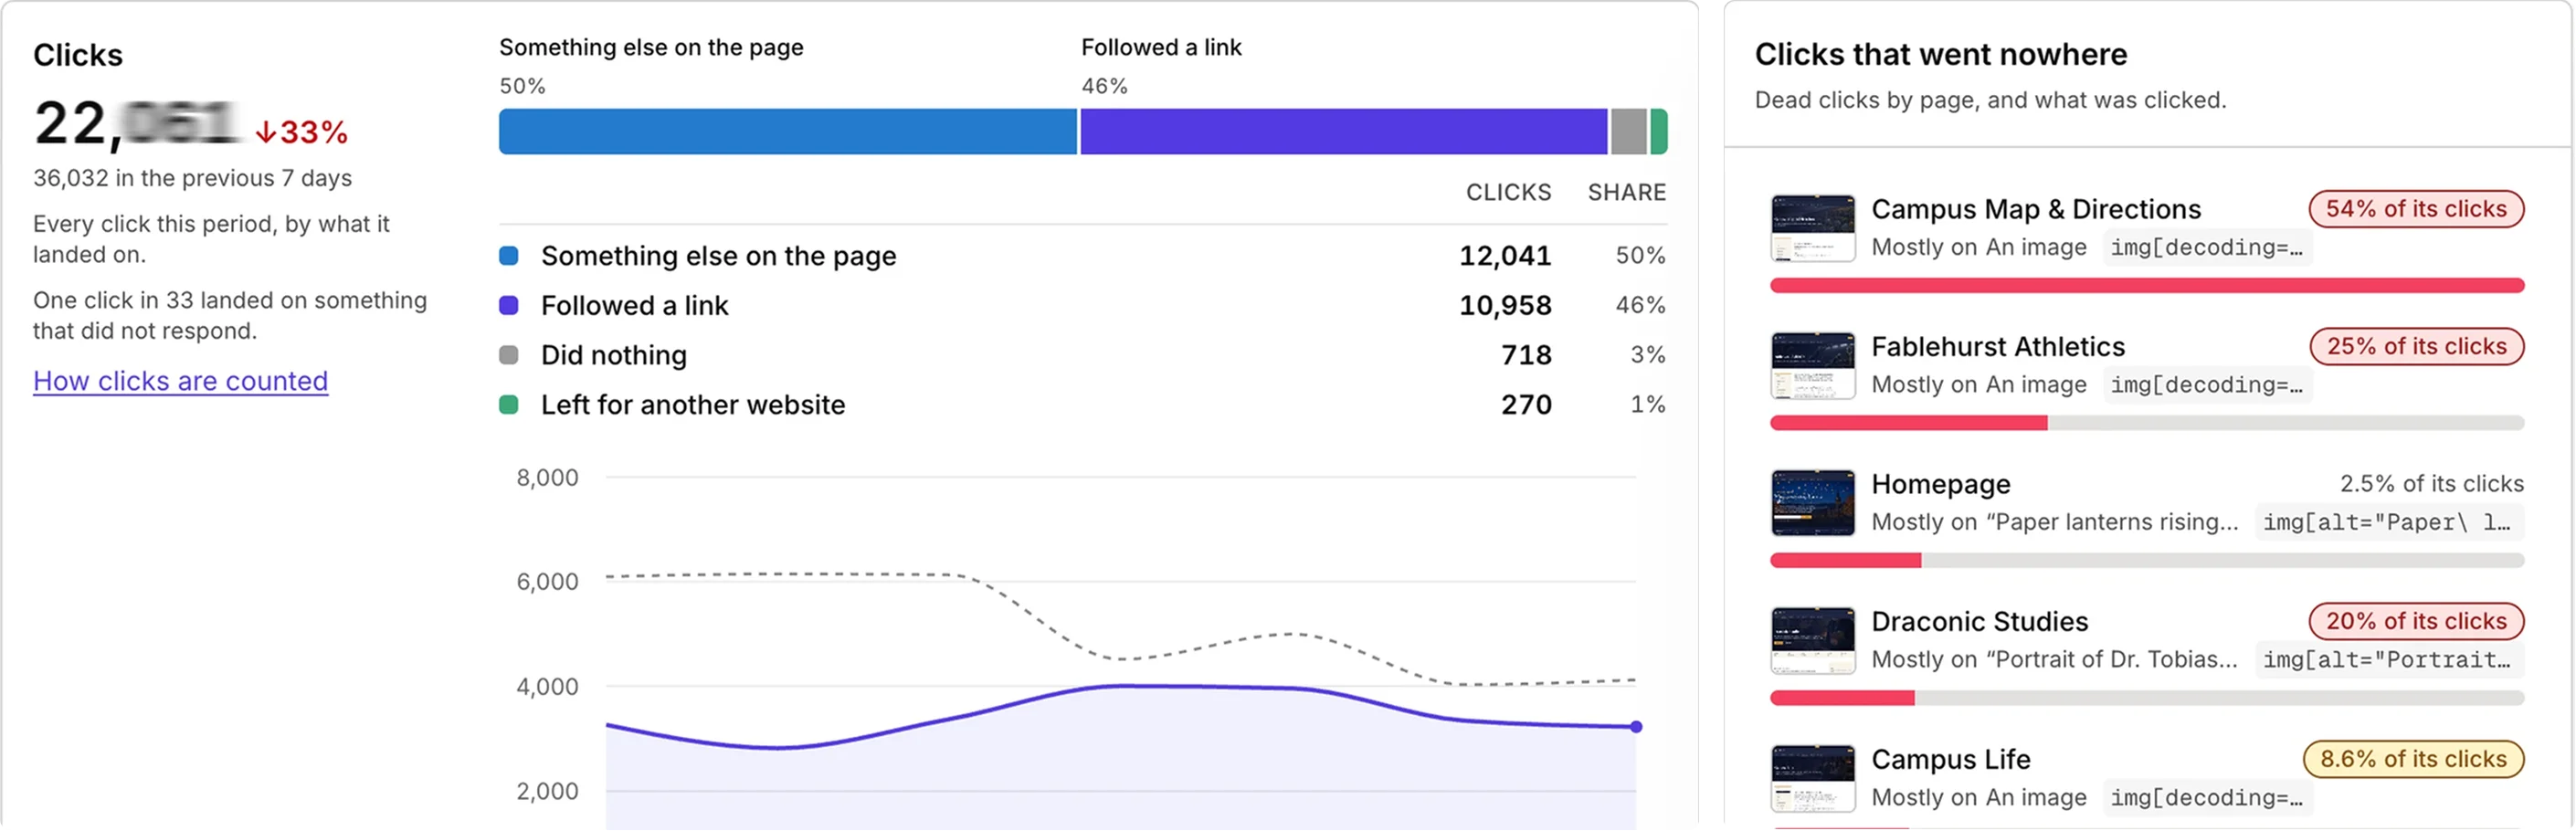
See how visitors interact with your live pages without opening a separate heatmapping tool. 3D click maps show where people click, while scroll maps highlight where visitors lose interest and drop off your layout.

Frustration mapping
Uncover UX barriers that standard pageview totals hide. Automatically flag dead clicks and rapid rage-clicking on non-clickable headings, giving your team concrete places to investigate and fix.

Behavioral analytics, visual heatmaps, and AI optimizer reports. All in one place.
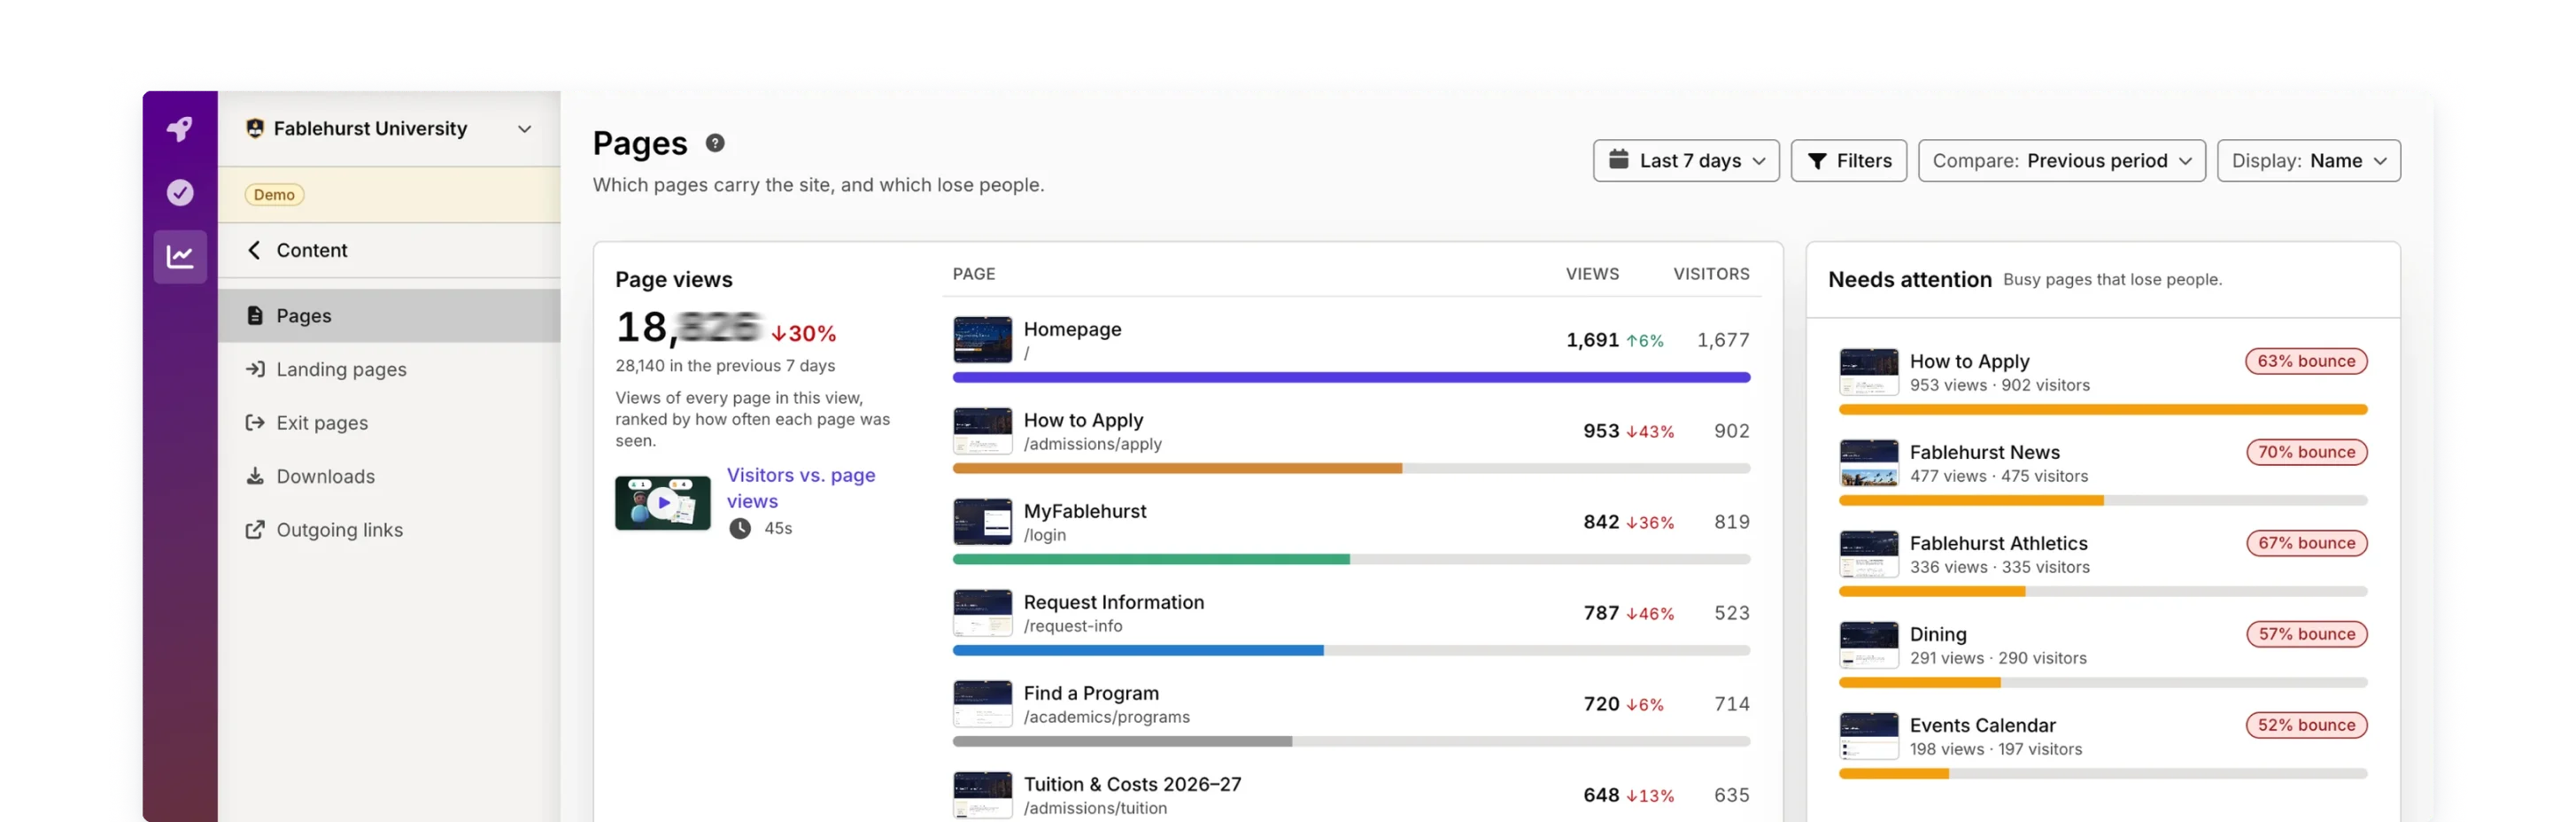
Workflow intelligence
Actionable website recommendations, not complex reporting dashboards.
Silktide’s AI optimizer reads your entire analytics view, opens your page screenshots, and writes a clear, prioritized improvement plan.
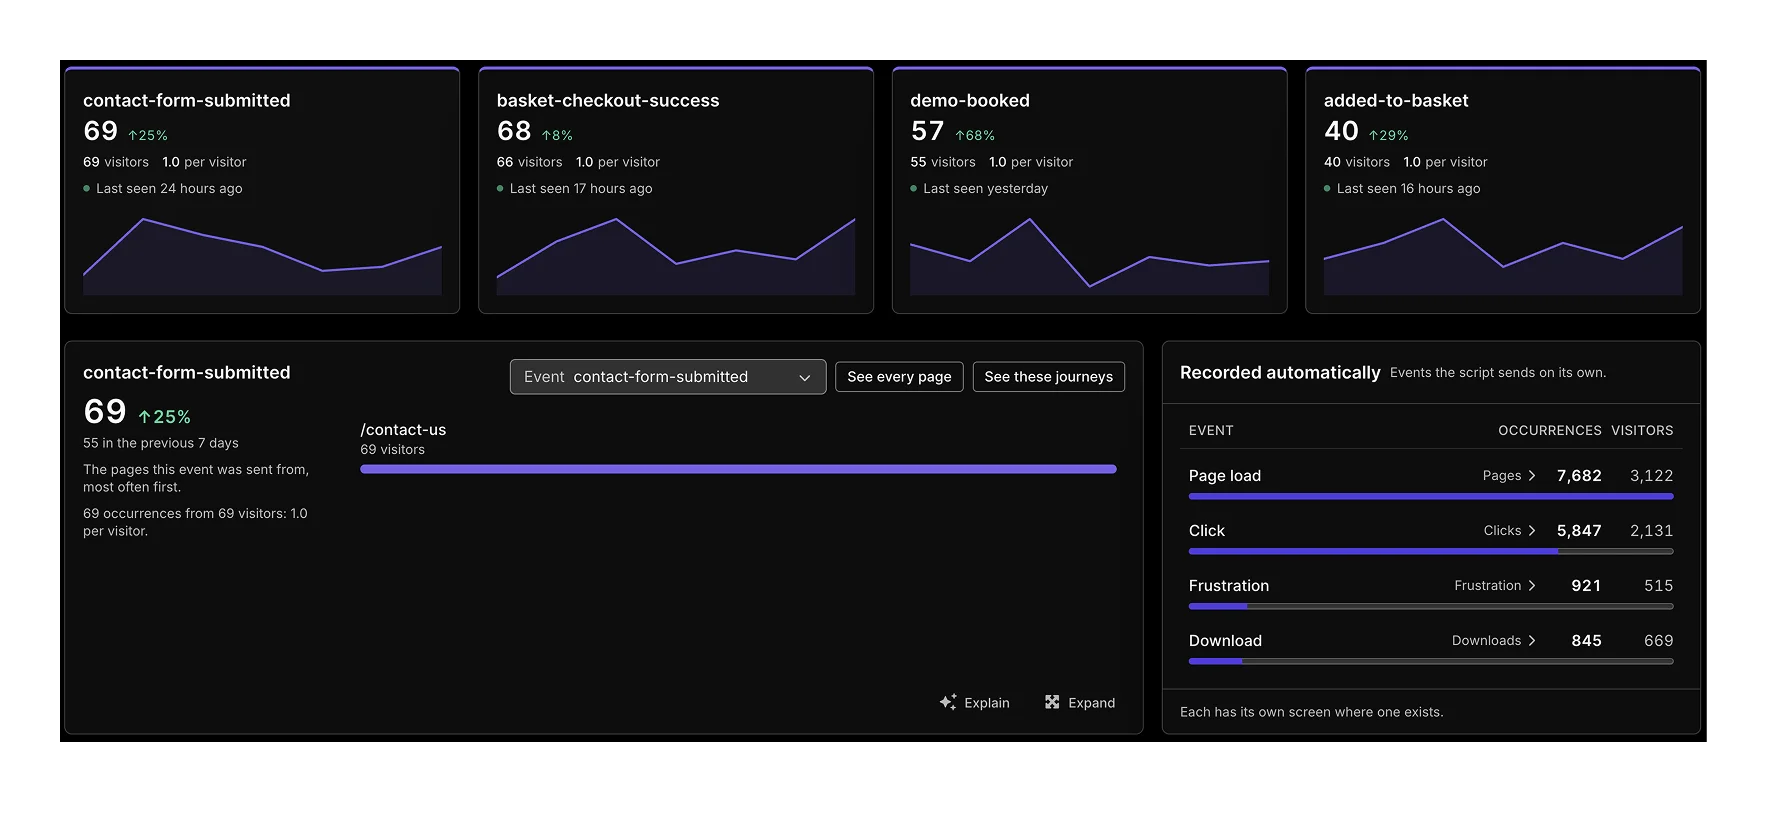
Goal optimization
When you set a conversion goal, AI optimizer works backward from completed journeys to identify the exact elements on the page holding users back.

Built for users
Deep behavioral insights with a privacy-first foundation.
Understand how people use your site while respecting user privacy. Silktide offers flexible visitor measurement options, allowing you to capture accurate behavioral trends.
AI traffic attribution
Automatically classify visits originating from AI, separating emerging discovery channels from standard web referrals.
User audience preferences
Measure real-world technical preferences across your audience to design experiences tailored to real device usage.
Retroactive goals and funnel analysis
Ask new questions about existing visitor data. Build custom conversion funnels and user paths instantly, using historical data.
Digital governance
Connect visitor behavior directly to website priorities. Reduce time needed between traffic data and site maintenance.
Silktide combines behavioral analytics with automated web governance, showing you exactly how many visitors encounter spelling errors, accessibility barriers, or slow assets on key pages.
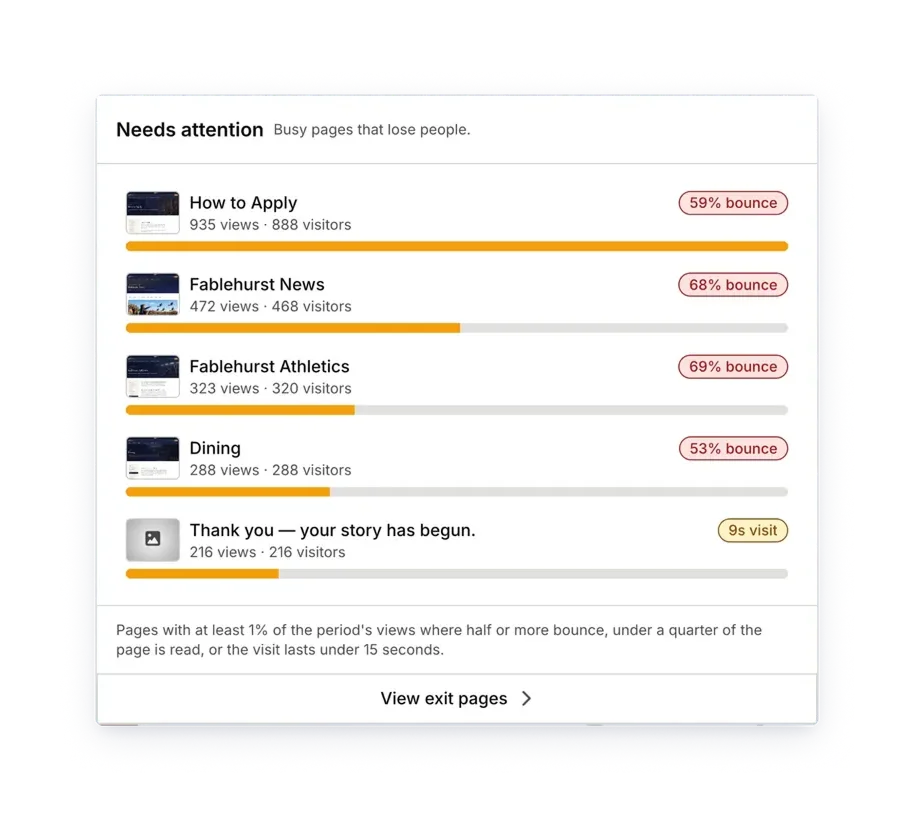
Pages named the way your team talks
Identify pages instantly with human-readable names and visual screenshots mapped from your existing content.
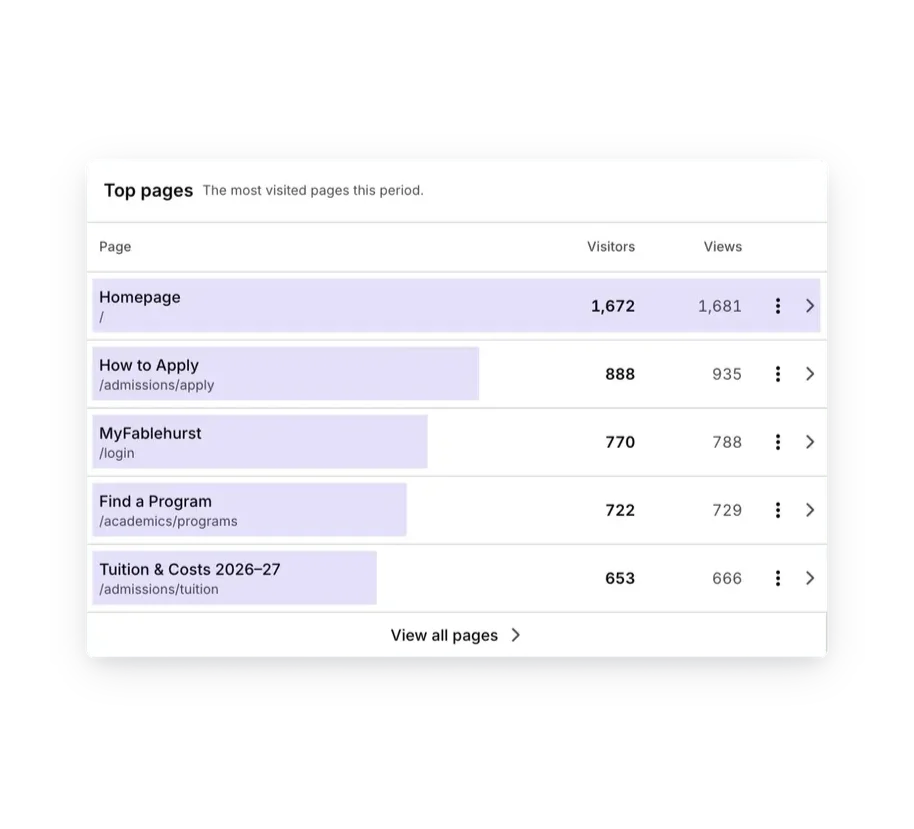
One script for your entire estate
Deploy a single analytics script across all your domains. New websites populate automatically as views the moment visits arrive, requiring zero manual property setup.

Direct task routing to team tools
Push clear, evidence-backed optimization briefs directly to Jira, Linear, Slack, or Microsoft Teams so your team can resolve friction points inside their existing workflows.
See analytics in practice
How the City of Bryan uses analytics to redesign around real visitor behavior
The City of Bryan, Texas, manages its websites in-house and uses Silktide’s analytics, including click, scroll, and frustration maps, to decide how pages are structured and what visitors see first. Since moving from traditional analytics, the team has increased page interaction by 10 to 15% while keeping the city’s sites accessible.


Silktide Analytics has given us the tools to make truly informed decisions, not just about what pages people are visiting, but how to structure those pages to give people the information that they are looking for first and foremost. We’ve probably increased page interaction 10 to 15% just in the short time we’ve had Silktide.
FAQs
What is Analytics?
Analytics is the part of Silktide that shows how visitors find and use a website, then names the changes worth making. It connects traffic, sources, goals, heatmaps, and journeys to the same pages and tasks used in Governance and Presence.
Does Silktide include heatmaps?
Yes. Analytics includes click maps, scroll maps, and frustration maps. In the Inspector they sit on the real page, including a 3D click map and a scroll map that folds as people leave. Frustration marks clicks that did nothing.
Does Analytics use AI?
Yes. Analytics Insights reads your data (including traffic, sources, devices, landing and exit pages, clicks, scrolling, and frustration), opens the pages themselves, and writes a prioritized plan. Goal optimization works backward from completions and names something on the screen. Each recommendation becomes a proposed task.
How is Silktide different from Google Analytics?
Google Analytics is a free, general traffic and campaign tool, especially for teams already in Google advertising. Analytics is built for the website team: pages with screenshots and friendly names, heatmaps on the page, AI that reads what the visitor saw, and tasks that go to the same board as Governance. It is privacy-first and does not send visitor data to Google.
Is Analytics included with Governance?
No. Analytics is its own Silktide product. Governance tests website quality; Analytics measures what visitors do. Teams often use both: a finding on the page, and the traffic or heatmap that shows it matters. One Silktide Script covers every site in the account.
Who is Analytics for?
Analytics is for website and digital teams responsible for improving the site, typically in enterprise, government, higher education, healthcare, and other organizations that need to understand visitors without invasive tracking. Editors, developers, and leaders can read the same reports.
Turn visitor data into confident website actions
See what Silktide analytics can do for your team.